
We have a big economic calendar, with featuring reports on sentiment, personal income and spending, and an especially interesting first estimate of Q3 GDP. The election campaign continues at high intensity and the COVID news grabs daily headlines. It is a huge week for corporate earnings, an important independent read on the economy.
None of these stories will dominate, allowing investors to choose their own focus. In my continuing effort to call attention to the truly important stories, I suggest that investors should be asking two questions on a wide range of topics?
- What should happen?
- What will happen?
For those who see the difference, and provide honest answers, there will be a great payoff.
Last Week Summary
In my last installment of WTWA, I suggested that important earnings news might cut through the daily election and pandemic updates. That was pretty accurate, with significant earnings stories reported every day.
Key Charts
I always start my personal review of the week by looking at some great charts. This provides a foundation for considering news and events. Whether or not we agree with Mr. Market, it is wise to know his current mood.
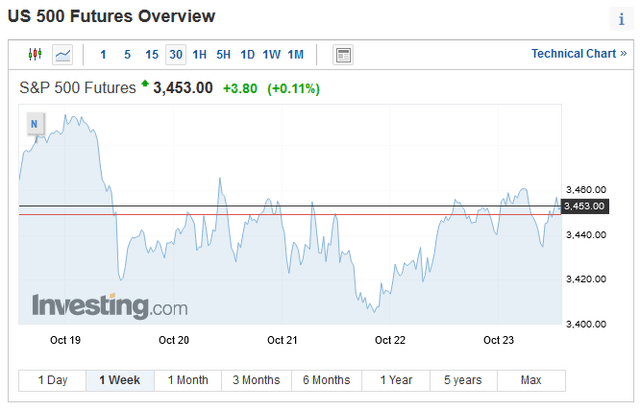
Market Story
This week I am featuring Investing.com’s futures chart. I like this version since it provides a glimpse of overnight action. If you visit the site, you can see the news behind the indicators.
Sector Trends
Sector movement is another important clue to market trends.
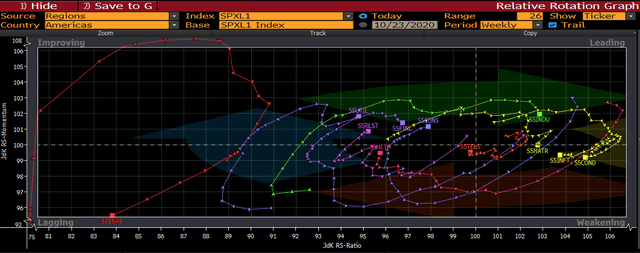
Once again, Juan Luque provides us with some words of wisdom from the Incline trading desk:
The Communication Services sector led the way this week returning over 2% and started moving towards the improving quadrant. The Financials, Utilities, and Energy sectors were also up this week. For Utilities, it continues moving strongly in the improving quadrant and with the Financials sector they both move towards the leading quadrant. The remaining sectors were down for the week, with Information Technology losing over 2% and sliding in the lagging sector’s direction. Real Estate reversed in its path and lost strength falling backwards towards the lagging quadrant as well.
Comment
The market lost 0.5% for the week with a trading range of only 2.5%. This is pretty quiet action, as you can see from the volatility summary in my Indicator Snapshot, featured in the Quant Corner. Despite the narrow trading range, this chart from Investing.com shows the continuing high levels for VIX trading.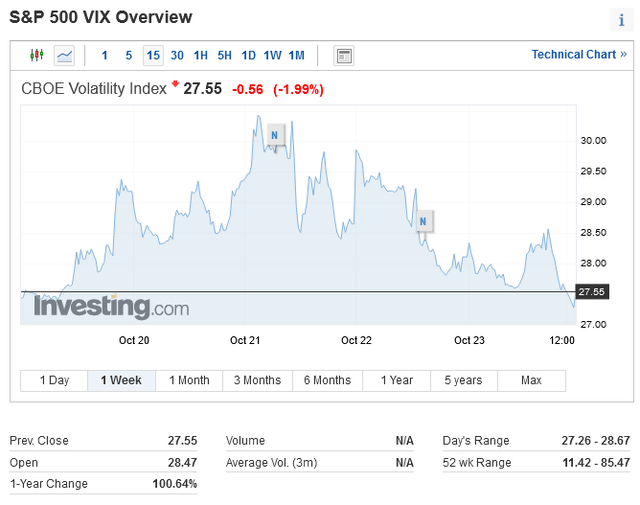
Personal
Thanks for the comments on the revised format for WTWA. One objective is to provide specific key updates in the context of a single topic. This allows me to highlight the most important data as well as provide context. The carefully selected charts illustrate information which I find to be most important. You are seeing only the best.
In the theme section, I am determined to raise questions that others have ignored. This is a challenge in most formats. It feels better than my prior approach, but once, again comments are welcome.
I am “attending” a conference for most of next week, so I might not publish a full installment of WTWA.
Noteworthy
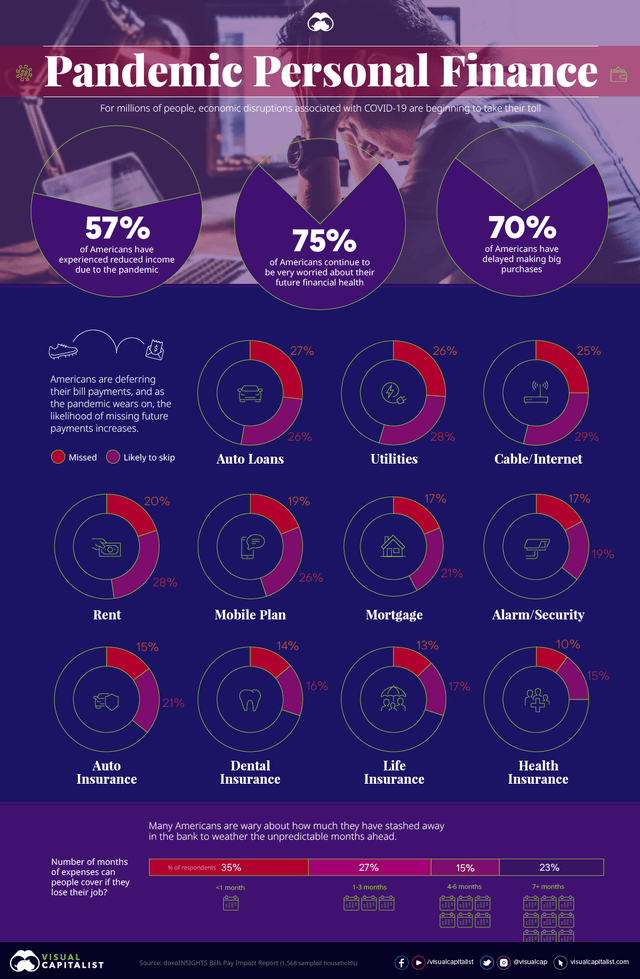
The Visual Capitalist has a typically fine analysis and graphic representation of pandemic effects on spending.
The News Overview
Each week I break down events into good and bad. For our purposes, “good” has two components. The news must be market friendly and better than expectations. I avoid using my personal preferences in evaluating news – and you should, too!
My continuing assessment is that many of the normal economic indicators are not helpful in the wake of the COVID lockdown decline. Too many sources are focused on a change in direction, even if very modest. Looking at indicators that show the level of activity paints a different picture. Consumer spending remains high, aided by government assistance programs. Employment has improved (although less than the numbers seem to show), but those gains have stalled.
The recession has not ended nor is there an end in sight.
Good
Housing
The news from the housing market remains upbeat, including several reports from last week.
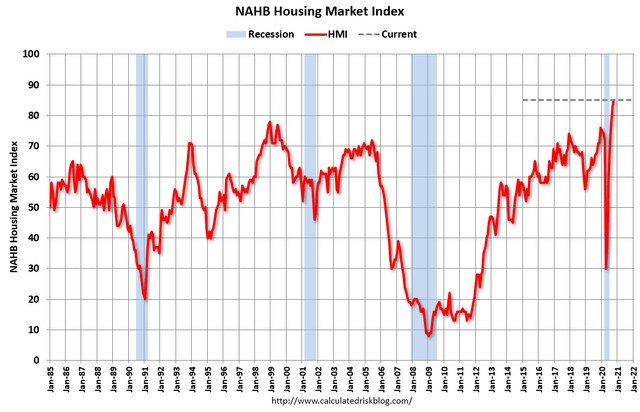
- NAHB Housing Market Index for October increased to 85 (a record high) from 83 in September. (Calculated Risk).
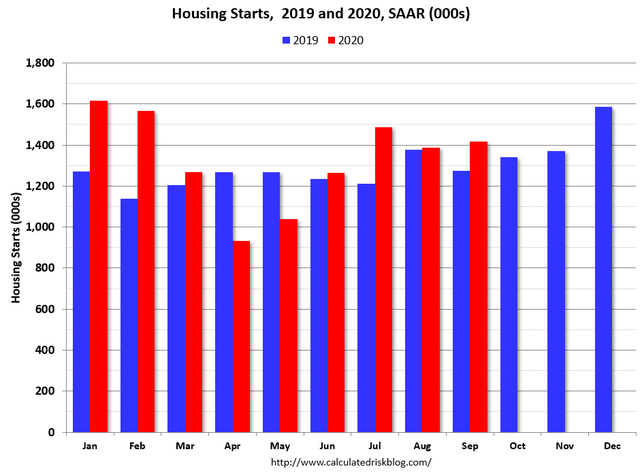
- Housing starts for September registered a SAAR of 1415K, slightly lower than expectations of 1430K but beating August’s (downwardly revised) 1388K. Calculated Risk observes:
Last year, in 2019, starts picked up towards the end of the year, so the comparisons were easy in the first seven months of the year..Starts, year-to-date, are up 5.5% compared to the same period in 2019. This is below my forecast for 2020, but I didn’t expect a pandemic! I expect starts to remain solid, but the growth rate will slow.
- Building permits for September hit a SAAR of 1553K, beating expectations of 1510K and August’s 1476K.
- Existing home sales for September reached 6.45M ahead of expectations of 6.1M and August’s 5.98M – all SAAR of course.
Employment
- Initial jobless claims declined to 787K, beating expectations of 860K and the prior week’s 842K (revised down from 898K). While still high, this is the best level in months.
- Continuing claims declined to 8.373M down from a downwardly revised 9.397M.
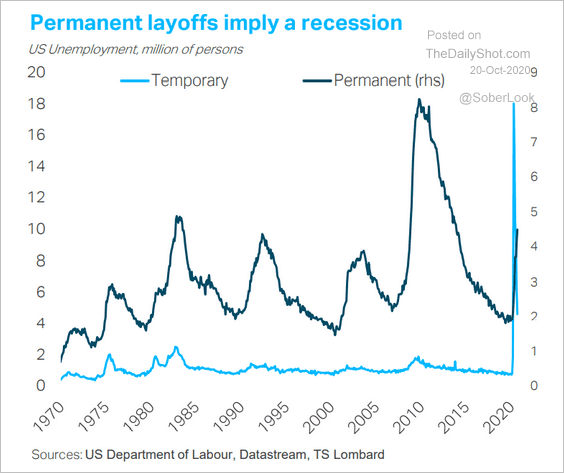
- One employment drawback: The level of permanent layoffs remains recessionary.
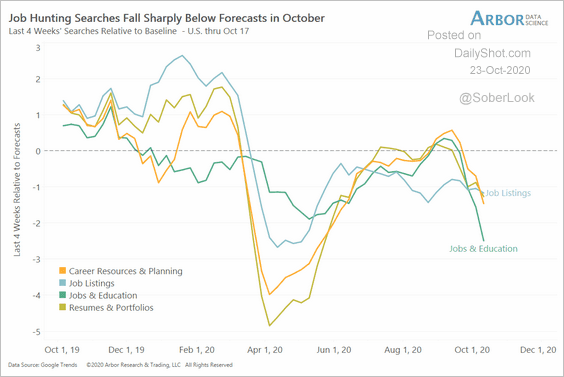
- Job searches are declining rapidly.
Corporate Earnings
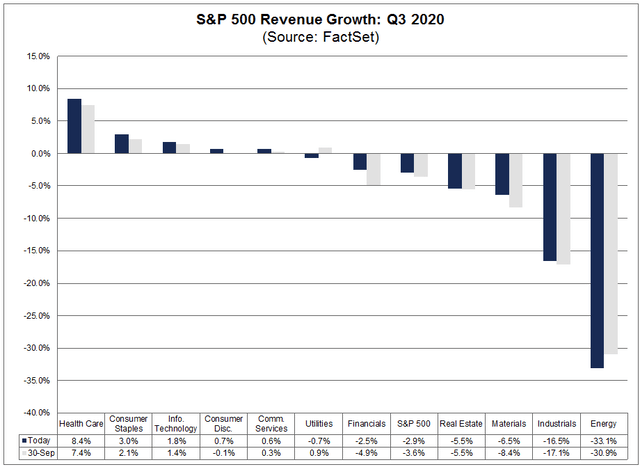
- The Early Results are beating expectations at a record pace. John Butters (FactSet) reports:
At this point in time, the percentage of S&P 500 companies beating EPS estimates for the third quarter and the magnitude of the earnings beats are at or near record levels. As a result, the index is reporting higher earnings for the third quarter today relative to the end of last week and relative to the end of the quarter. Despite the increase in earnings, the index is still reporting the second largest year-over-year decline in earnings since Q2 2009, mainly due to the negative impact of COVID-19 on numerous industries within the index.
Revenue growth is also beating expectations but remains at modest levels.
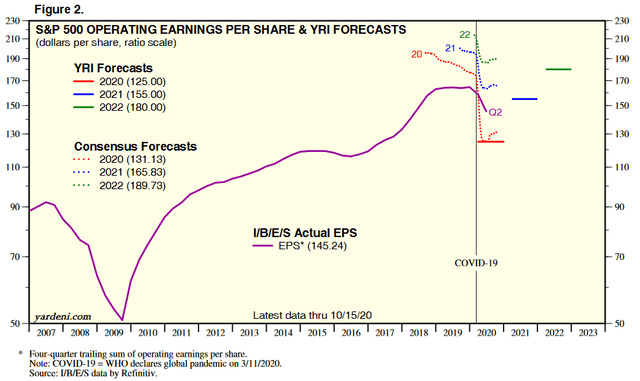
- Forward Earnings Revisions “look great” reports Brian Gilmartin.
- Dr. Ed Yardeni confirms the rebound, the path of revisions, and the importance of this data.
- Conference call transcripts generally confirm the data (The Transcript). Reading quotations from executives at specific companies is helpful if you have not read the complete transcript. Here is their summary:
Earnings season kicked off this week. The nation’s big banks reported earnings and for the most part provided positive economic commentary. We are seeing a return to a generally sound economy and confidence has improved a lot. Credit performance has been much better than expected and if nothing changes banks probably have a lot of excess reserves. The election creates the potential for near-term volatility but the end of the pandemic is hopefully in sight.
Bad
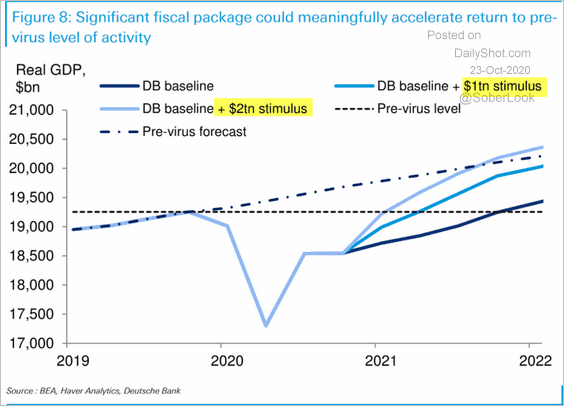
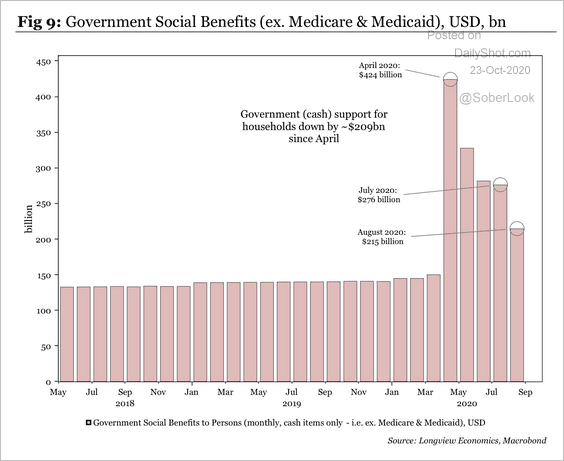
Fiscal Stimulus
As I write this post, the negotiating parties remain far apart on any stimulus bill before the election. There is a lot of finger-pointing, of course, but no sign that bargains are being struck.
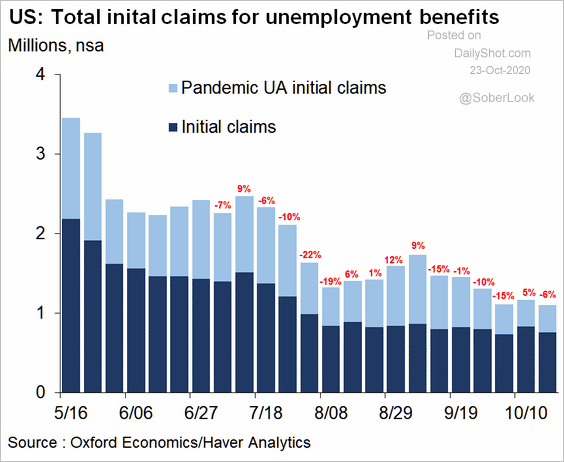
- Social Cost. The impact of the impasse is shown in this chart.
Barron’s uses data from Moody’s Analytics to reach similar conclusions:
An analysis by Moody’s Analytics finds that if Biden wins and Democrats win a majority in both the Senate and the House and enact his plans, average annual economic growth would be 2.9% and average annual wage growth would be 0.9% through 2030.
Moody’s finds that some 18.6 million jobs would be created over Biden’s four-year term, and full employment would be reached in the second half of 2022. Full employment is typically defined as an unemployment rate under 5%. It is about 8% today.
In contrast, if President Donald Trump wins the election and Republicans win the majority in both houses of Congress, the economic picture dims: 10-year economic growth would average 2.4%, wages would grow by 0.7% over a decade, 11.2 million jobs would be created over four years, and full employment would be reached in 2024.
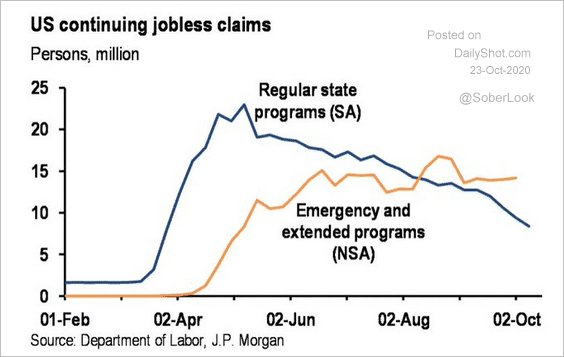
- Individual Cost. This chart shows what the declining benefit pace.
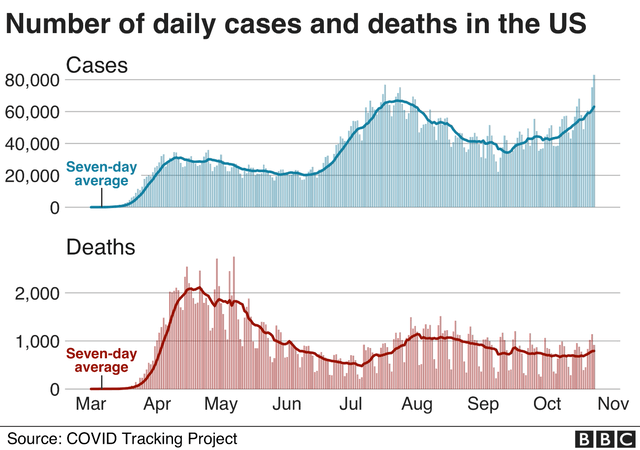
Coronavirus wave
- Excess deaths (CDC) have been estimated at 216,025 as of October 15th. The CDC explains why this might well be an underestimate.
- A wave of new cases – more than 80,000 in a single day.
Coronavirus cases break records as states in every part of U.S. reel under the surge
Coronavirus: US cases reach record high amid new wave of infections
Key Economic Indicators
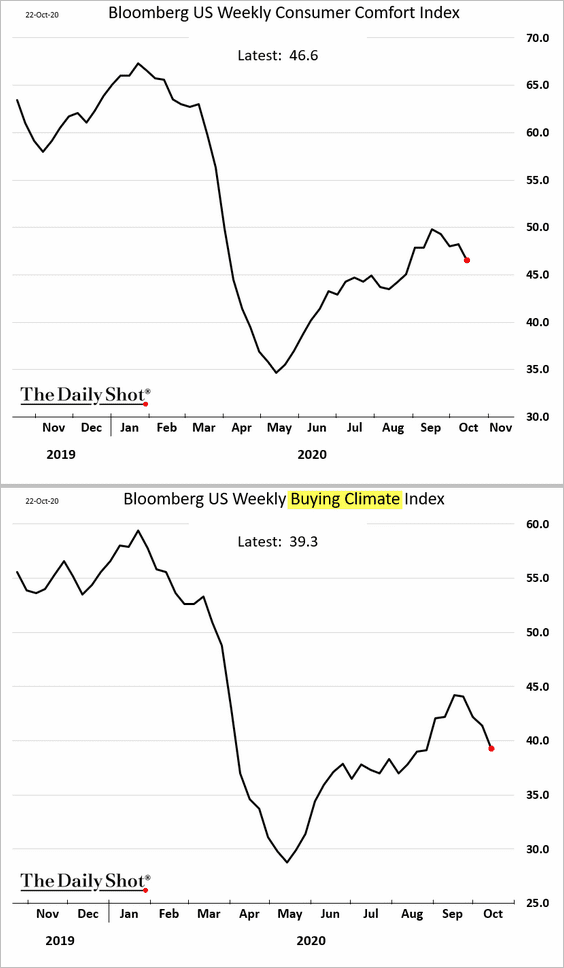
- Consumers are less willing to spend.
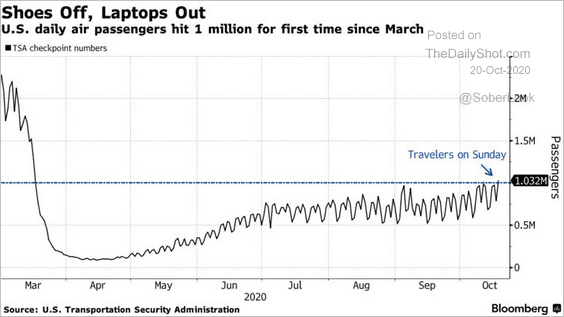
- Air Travel is rebounding, but the pace is glacial.
- Europe shows signs of a “double-dip recession.” (James Picerno). He wonders if the US will avoid this risk.
Brian Wesbury is confident of the recovery, calling for a soaring GDP in the Third Quarter.
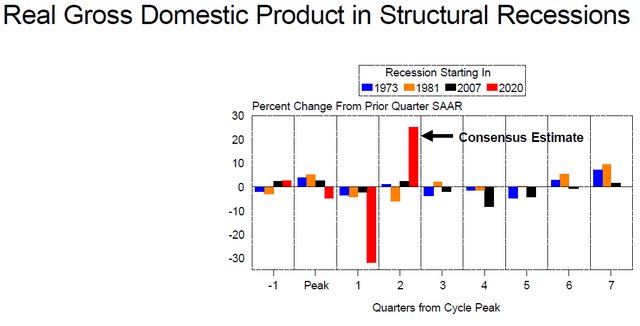
Bob Dieli compares the rebound to past recessions.
New Deal Democrat’s high frequency indicators (including many of the “turning point” statistics that worry me) show continued strength in all time frames. He remains concerned about both the pandemic and the election.
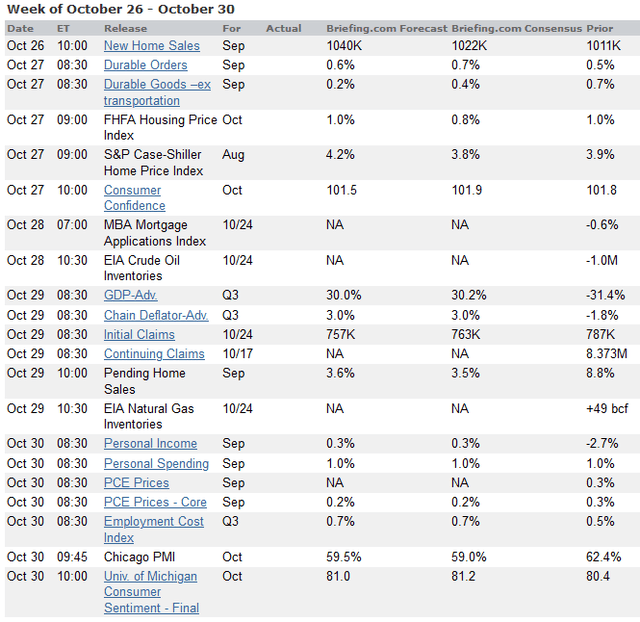
Calendar
We have a big week for economic reports including GDP components and the GDP estimate itself. Consumer sentiment remains important. Personal income and spending represent the most important hard data. In addition, we have housing data, jobless claims, and durable goods. Earnings season is reaching a peak.
Briefing.com has an excellent weekly calendar and many other useful features for subscribers.
Theme and comment
It is a huge week for corporate earnings, with 183 S&P 500 companies on the schedule. While this is the most important hard news for investors, political events, COVID-19 updates, and vaccine news will compete for attention.
We should be carefully following corporate earnings, as I suggested last week. That said, it is more important to do some clear thinking before the election. Investors should be asking:
What should happen? And what will happen?
This should be a regular routine, but it is now more important than ever.
Current obsessions
Wall Street remains focused on the election results and the pundit guesses about the implications. There is a quiet confidence in the economic rebound and prospects for nearly all companies.
Few seem concerned about a mistaken focus, overlooking the continuing recessionary data.
Nuggets
If I had to pick one article for investors this week it would be this article from Jay C. Shambaugh, writing at Econofact:
The Role of Automatic Stabilizers in Fighting Recessions
Mrs. OldProf looked over my shoulder at the title. As she has over our 41 years of marriage (anniversary last week) she had a little advice. “You can’t pick a nerdy article like that as your top choice!” I take her point, but there will never be a better time for readers to consider this topic. I did not ask her if I had lost my “nerd card.”
An automatic stabilizer is counter-cyclical economic policy that kicks in when needed. The article explains that the advantages are speed of response, facilitating advance planning, do not “turn off” too quickly, and avoid the political controversy over the need for action. The article is very readable and informative. The biggest problem in current stabilizers is that they are too small, despite special importance in the low interest rate environment.
Fool’s gold
Some are citing historical returns to show a small percentage advantage or disadvantage based upon the season or the election cycle or something else. None of these amounts is significant compared to what is actually at stake. Are you attracted to a long-term historical gain of 1.5% for such a strategy?
Relevant questions for investors
The Biggest Single Mistake –Asking the Wrong Question
In my decades of investment experience, I have had plenty of opportunity to observe behavior. My background as a social scientist encouraged me to do so. This is a proposition that readers have probably seen before, but not in this context.
As an investor, do not live in a prescriptive world! I agree with you. There are many problems, misunderstandings, and poor policies. Many of your ideas are probably better. If we sat down together over a refreshing beverage we would agree on many things and disagree on others.
Here is the problem: Our opinions about what should be done are not relevant – at least not without political organization and aggregation.
The Right Question? What Will Happen?
We do not know for a certainty what will happen, but we can frequently make strong approximations. We do not even get started on the right track, since we pose the question in the wrong way.
Example
The biggest examples are those of the Fed bashers. This group consists of fund managers, bloggers, and pundits who have consistently written about what the Fed is doing wrong. There is plenty of room for Fed pontificating and no membership card is required. An interesting fact is that the critics frequently take opposing positions!
None of this analysis or commentary was profitable for investors.
If you asked instead what the Fed was likely to do, you would probably have been correct. A little help from leading Fed observers like Tim Duy would put you on the right track. Reading a few comments from the Fed Chair and other members would take you the rest of the way.
This is one way I have stayed on the right side of the market for a decade. It is not that difficult, if you ask the right question.
Those taking the prescriptive approach to economic policy and markets run very profitable businesses. They determine what readers want and deliver it.
Applying This Insight
Here are some examples of costly personal opinions.
“Amassing debt is a blunder. It is time to turn off the government spigot.”
Whether or not you are correct is irrelevant. You should assume significant future debt fueled stimulus. With that in mind, you can then determine your investment posture.
“We should reopen in the face of COVID risks since the mortality rate is low among all except the elderly. The data are suspect. Economic limitations are too expensive.”
These conclusions are irrelevant because many government jurisdictions will not agree with your conclusions. It does not matter whether you are correct. Think more deeply about what you expect public officials to do in the face of the COVID data.
Quant Corner
I have a rule for my investment clients. Think first about your risk. Only then should you consider possible rewards. I monitor many quantitative reports and highlight the best methods in this weekly update, featuring the Indicator Snapshot.
Indicators
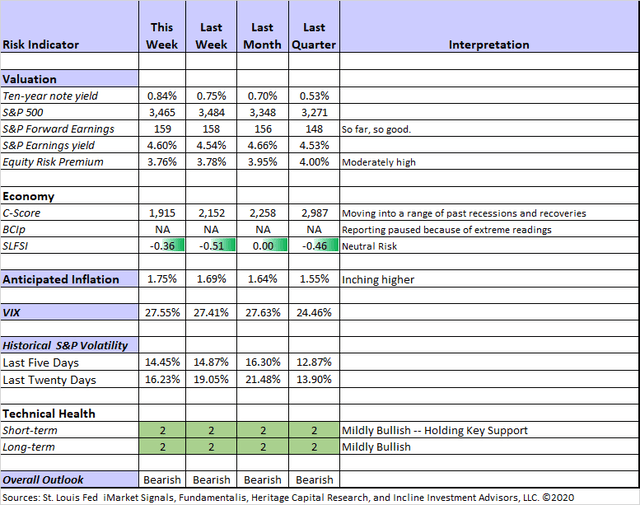
For a description of these sources, check here.
Comment
Technical measures remain reasonably strong. Trends remain intact and support levels have generally not been violated.
My continued bearish posture for long-term investors is based upon both valuation and continuing fears about the continuing recession.
Guest ideas
The options market provides a great method for estimating moves after important events. Usually these are things like drug trials, or earnings announcements. What do you think the estimate is for the upcoming election?
How about a one-day move of more than ten percent? (Reuters)
Final Thought for Investors
In my revised format I am including specific economic worries as part of the good and bad news. In the Final Thought I hope to emphasize action that investors should consider taking – and especially what they should not do. I am amazed by those who have declared an end to the recession. Even the worriers are discussing a “double dip.” Wow.
It is a challenging time to be consistently driven by data!
My Portfolios
I continue to maintain higher than normal cash levels as a cushion against the continuing recession. It is possible to do this and still meet your goals provided you do not make extreme decisions. I am doing well in all stock portfolios, mostly by selecting less risky stocks.
Most important takeaway
Asking only two questions will help attain objective clarity. Try it!
Thinking about Risk – and Future Opportunities
Take a little time to review your holdings and ask how they would do under various scenarios. My recent white paper on this topic provides a method for finding and measuring risk. It provides solid information that does not fit well in my regular posts. I also urge you to join my Great Reset research group where we are discovering the best post- recession investments.
There is no charge and no obligation for either the Portfolio Risk paper or the Great Reset Group. Just make your request at my resource page.
My new Marketplace service, Yield Boosting Corner, has delivered cash flow at an annualized pace of over 20% in the first six weeks. The positions are low risk. It is easy to follow the system from my email alerts. You can also enjoy the chat room where many of us hang out. Or you can study in depth via my weekly videos.
There is no “magic” in my approach and no swinging for the fences. Just patience, discipline and a monthly paycheck.
Start today with a two week free trial!
Disclosure: I/we have no positions in any stocks mentioned, and no plans to initiate any positions within the next 72 hours. I wrote this article myself, and it expresses my own opinions. I am not receiving compensation for it. I have no business relationship with any company whose stock is mentioned in this article.